Member Profile: Helen-Nicole Kostis
1. What do you do and how long have you been doing it?
I am a data visualization developer at the NASA Goddard Space Flight Center. Based at the Scientific Visualization Studio (SVS) I serve NASA’s Earth Sciences by creating data-driven visualizations, conduits and experiences to communicate research findings about our planet’s changing climate. I have been exploring the field of scientific data visualization for 16 years.
2. What was your first job?
My first job was art gallery assistant. During my undergraduate studies, I worked part-time in the evenings in a small art gallery in the city of Ioannina, located in the northwest region of Greece. The art gallery exhibited paintings and drawings from local artists and was connected to the only local store that sold art supplies. It was a fun job as I always had a tremendous appreciation for the arts and it allowed me to learn about local artist techniques on various media.
3. Where did you complete your formal education?
I grew up and went to school in Greece in Maroussi, one of the northern suburbs of Athens. Upon high-school graduation, I studied mathematics at the University of Ioannina, in northwest Greece. It is a mountainous area with superb natural beauty. After a gap year where I taught informatics in public schools, I ventured to the Electronic Visualization Laboratory (EVL) at the University of Illinois at Chicago (UIC), where I completed a Master’s in Computer Science and later a Master’s in Fine Arts (MFA) in Electronic Visualization. My years at EVL have been formative and instrumental for my practice. I literally found myself inside an endless playground that nurtured experimentation, fostered collaboration, and encouraged initiatives at the intersection of art and sciences using state-of-the-art technology.
4. How did you first got involved in SIGGRAPH?
Getting involved in SIGGRAPH was an organic development. During my graduate studies, I served as a research assistant at EVL, which has a rich history with SIGGRAPH. EVL directors and key team members Tom DeFanti, Daniel Sandin, Maxine Brown, and Dana Plepys have been instrumental in forming and developing the ACM organization and the conference. Supporting SIGGRAPH was a big part of the lab culture and aligned with the spirit of “we always give back to the communities of computer graphics, visualization, and the arts”. During my years in EVL, I remember supporting SIGGRAPH presentations and events. I watched SIGGRAPH video reviews and historical video recordings of pioneering computer art from the 70s and strived to submit to the conference.
5. What is your favorite memory of a SIGGRAPH conference?
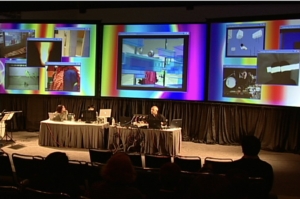
My favorite SIGGRAPH memory was the first time I presented! In 2005 our collaborative telematic performance “Loose Minds in a Box” was featured in the Emerging Technologies program. For the purposes of the event I attended virtually to demonstrate the concept of the work. In one of the firsts for telematic performances, my friend Tina Shah and I collaborated with approximately 20 technologists, computer scientists and artists across North America to deliver a synchronized and unified performance using the Access Grid technology, under the direction of Jimmy and Elizabeth Miklavic of Another Language Performing Arts Company. It was kind of surreal seeing similar events during the COVID-19 pandemic almost three years ago.

“Loose Minds in A Box” at SIGGRAPH 2005. Miho Aoki (left) performing locally and Jimmy Miklavic (right) directing and mixing in real-time over 15 Internet-2 streams from multiple Access Grid sites, across North America. Photo courtesy of Another Language Performing Arts.
6. Describe a project that you would like to share with the ACM SIGGRAPH community.
Sure! I would like to share one of our latest and most challenging endeavors – our work for NASA’s Earth Information Center (EIC).
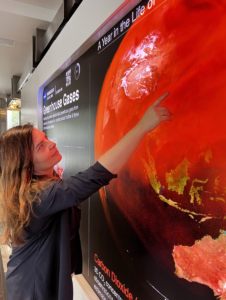
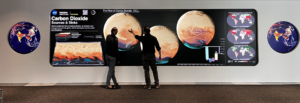
On June 21, 2023, NASA launched the Earth Information Center (EIC) in Washington, DC, which includes a public facing exhibit open to visitors Monday-Friday 8:30am-5:30pm EDT. Part of the exhibit is a 22-foot LED hyperwall framed by two circular 4K screens. The hyperwall features narrated video pieces, larger-than-life data-driven visualizations and dashboards to tell the story of how our planet is changing in areas that affect lives and livelihoods. The mission of the EIC is to show how viewing Earth from space can improve lives in the face of environmental challenges and climate change.

Helen-Nicole Kostis in front of the Greenhouse Gases Dashboard, Hyperwall Display, NASA Earth Information Center. Photo by Brenda Lopez Silva
As part of this effort, I led the design and development activities for the dashboards as well as the production of visualizations for the narrated video pieces. The dashboards were brought to life thanks to both the incredible efforts and talent from teams across the agency and the data provided from partnering agencies, like NOAA, FEMA, and EPA, to name a few. The dashboards feature near real-time satellite observations (Worldview), the latest scientific models (GMAO), our planet’s climate vital signs, events (Earth Observatory) as well as awe-inspiring visualizations developed by our studio (SVS). This effort just started and our teams are committed to bringing the latest data and climate research findings to everyone. If you are in DC or visiting the area, please come and check it out!

Carbon Dioxide Sources and Sinks Dashboard on the Hyperwall display, NASA Earth Information Center, Washington DC, Photo by Helen-Nicole Kostis.
7. If you could have dinner with one living or non-living person, who would it be and why?
I would love to meet German filmmaker Werner Herzog and one of my dreams is to work with him. I am huge fan of his body of work, especially how he directs landscapes and sculpts time in his films. I have enjoyed his entire filmography, including his early works of his that are in German, even if I do not speak the language.
8. What is something most people do not know about you?
Few people know that virtual reality art is my background and part of my formal training. In the early 2000s, I created collaborative series of networked virtual reality experiences and artworks in CAVEs, using high-speed research networks. An example of such work is “Virtual Unism” (2005).